2026
EB-5 Targeted Employment Area (TEA) Guide: How to Qualify for the $800,000 Investment
Successfully qualifying a project location as a high-unemployment TEA requires methodical analysis, transparent documentation, and strict adherence to regulatory standards. Whether your project qualifies through a single census tract or requires careful aggregation of contiguous areas, USCIS expects every calculation to be verifiable, every data source to be current and official, and every geographic boundary to be defensible.
Need help for EB-5 case? Contact us to navigate the right pathway for your case.
– Understanding Targeted Employment Area TEA Status in EB 5 Investment Visas –
Introduction: Why TEA Status Is Critical for Your Investment
If you’re considering investing in the United States through the EB-5 program, or if you’re a developer or attorney working on such projects, you’ll quickly encounter the term “Targeted Employment Area,” or “TEA”. This designation isn’t just technical jargon; it’s a crucial factor that can significantly impact both your investment amount and your chances of approval.
What’s at stake? When a project location receives TEA status, investors can qualify for the program with a reduced investment of $800,000 instead of the standard $1,050,000, a savings of $250,000. That’s substantial. However, this reduced threshold comes with a tradeoff: immigration officials at U.S. Citizenship and Immigration Services (“USCIS”) will examine your TEA claim closely.
USCIS examiners don’t take shortcuts when reviewing TEA designations. They expect your documentation to demonstrate mathematical accuracy, clear methodology, and strict compliance with all regulatory requirements. Think of it like a financial audit: every number must be verifiable, every assumption must be justified, and every claim must be supported by official data sources.
Why does this matter? A TEA application that appears hastily assembled, uses questionable data sources, or takes creative liberties with geographic boundaries will likely trigger what’s called a Request for Evidence (“RFE”). An RFE means USCIS has concerns and is asking you to provide additional documentation, which can delay your case by months. In some cases, poorly documented TEA claims can lead to outright denials, even when the underlying business project is otherwise solid and well-structured.
In simple terms: precision and clarity in your TEA documentation can determine whether you experience a smooth approval process or face months of frustrating delays and additional costs.
Two Paths to TEA: Rural vs. High-Unemployment Areas
Current EB-5 law (updated by the Reform and Integrity Act of 2022) provides two distinct pathways for a project location to qualify as a TEA: rural or high-unemployment. Each pathway has its own rules, advantages, and documentation requirements:
Option 1: Rural Targeted Employment Areas
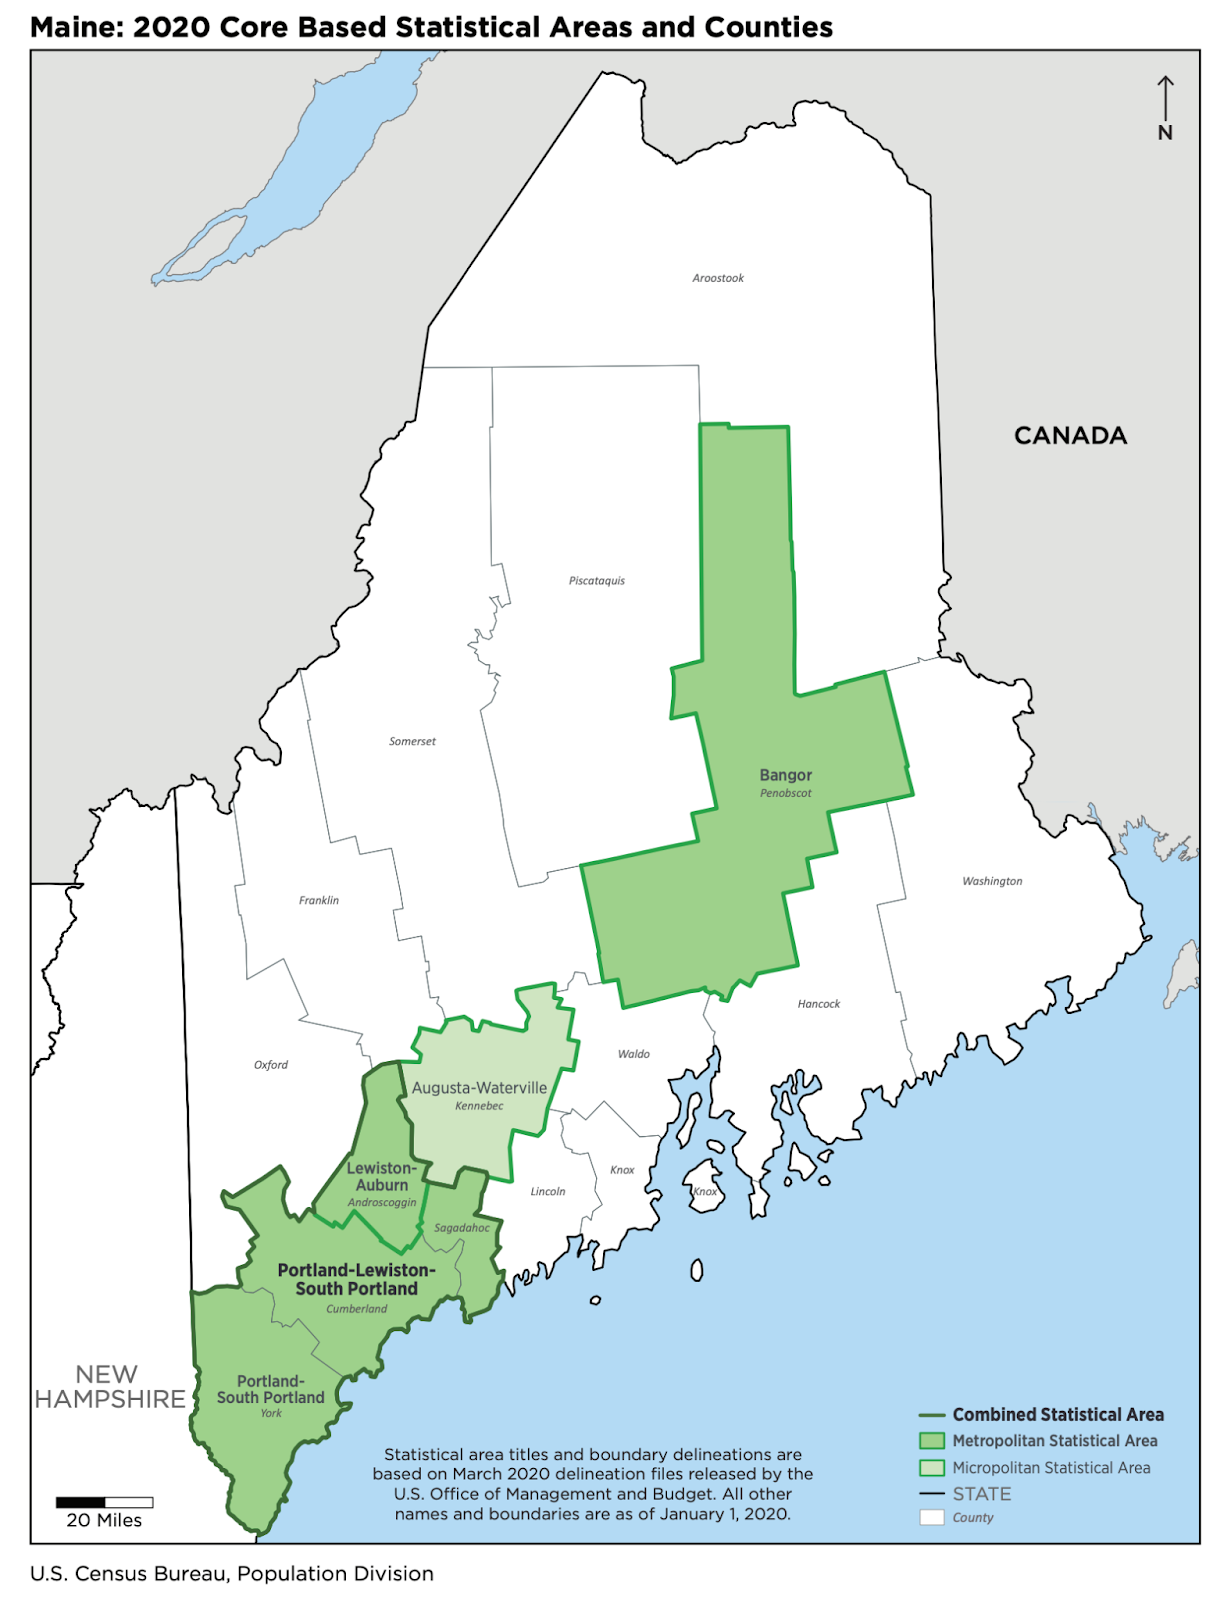
A rural area, for EB-5 purposes, is generally any location that lies outside both a Metropolitan Statistical Area (“MSA”) or the boundaries of a city or town with a population of 20,000 or more. MSAs are regions defined by the federal Office of Management and Budget that typically encompass major cities and their surrounding suburbs, so if a project is in a county that is not part of an MSA and is also not within a sizable municipality, it may qualify as rural. See the map below that identifies in white the counties that lie outside the MSA.
Even so, qualification is not automatic and requires careful documentation: applicants must use official federal geographic data, such as the federal Office of Management and Budget (“OMB”), to prove the project sits outside MSA boundaries and rely on official Census figures to confirm that it is not located in a town of 20,000 or more residents. Meeting this standard carries meaningful benefits, because rural TEA projects are eligible for the lower $800,000 investment threshold and receive preferential visa treatment, including a 20% annual set-aside of EB-5 visas for rural projects and expedited processing, which can substantially reduce processing times amid existing backlogs.
Option 2: High-Unemployment Targeted Employment Areas
A high-unemployment TEA is a place where unemployment is at least 150 percent of the national average. For example, if the national rate were 4 percent, any area at 6 percent or higher could potentially qualify, with the exact benchmark changing as national data is updated. The analysis starts at the census tract level, which are small, neighborhood-sized areas defined by the U.S. Census Bureau, and then follows a clear two-step process: (1) look first at the single census tract where the project is located. If that tract alone meets the 150 percent threshold, the project qualifies immediately, and no further analysis is needed; (2) if it does not qualify on its own, you may combine it with neighboring tracts to calculate a weighted average unemployment rate, meaning more heavily populated tracts count more in the calculation.
Any tracts used in this combination must be contiguous, which simply means they have to touch each other along a shared border. You cannot skip over areas to pick distant tracts with higher unemployment. While this pathway is commonly used for urban and suburban projects that do not meet the rural definition, it is also the most closely reviewed by USCIS, which carefully examines how tracts were chosen, what data was used, how the average was calculated, and whether the boundaries truly connect, making careful and transparent analysis essential.
The High-Unemployment TEA Calculation: Census Tracts and Contiguity
Under Option 2, qualifying a project location as a TEA based on high unemployment requires a structured and precise analysis. The methodology typically unfolds in the following steps.
Step 1: Identify the Project Census Tract.
The first step is to determine the precise census tract(s) in which the new commercial enterprise (“NCE”) or job-creating entity is principally doing business. The project’s address must be accurately mapped to the corresponding tract, which becomes the core tract for the TEA analysis.
Step 2: Evaluate Single-Tract Unemployment.
Next, the unemployment rate for that census tract is obtained and compared to the national average unemployment rate for the same time period and data source. If the tract’s unemployment rate is at least 150% of the national average, the tract qualifies independently as a high-unemployment area. If it does not meet this threshold, additional analysis using adjacent tracts may be required.
Illustrative Example of a Qualifying Single Tract
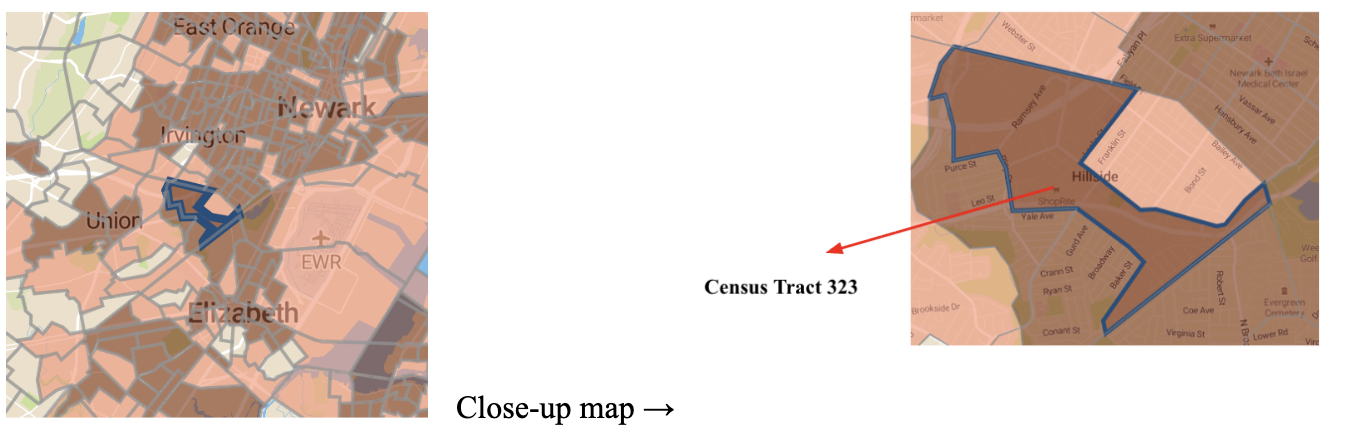
Census Tract 323 in Union County, New Jersey, serves as an example of a tract that qualifies on its own. This tract is located within the New York–Newark–Jersey City Metropolitan Statistical Area (MSA) and therefore does not qualify as rural. It is part of Newark, a city with a population well above 20,000.
Census Tract 323 in Union County, New Jersey, serves as an example of a tract that qualifies on its own. This tract is located within the New York–Newark–Jersey City Metropolitan Statistical Area (MSA) and therefore does not qualify as rural. It is part of Newark, a city with a population well above 20,000.
Census Tract 323 has an unemployment rate of 8.1%, which represents 155.8% of the national average unemployment rate. As a result, Census Tract 323 qualifies independently as a high-unemployment TEA using the ACS 2020–2024 5-Year data. It would also qualify under a combined-tract approach using LAUS 2024 1-Year data if five adjacent tracts were aggregated, although such aggregation is unnecessary here because the tract qualifies on its own.
Step 3: Select Contiguous Tracts for Aggregation.
Identify the census tracts that directly border the project tract, as well as any tracts that border those already selected. Only immediately adjacent tracts may be included. USCIS does not permit bypassing intervening areas or selectively linking distant high-unemployment tracts. The objective is to create a geographically cohesive cluster centered on the project site. Each additional tract should have a reasonable connection to the project area, such as being part of the same neighborhood or broader local economic region.
Policy changes implemented between 2019 and 2022 were specifically intended to curb “gerrymandering,” a practice in which applicants previously stitched together elongated chains of tracts to extend from affluent project locations to remote distressed areas. Under current standards, an expansive or irregular configuration of tracts is likely to draw scrutiny, as USCIS expects any combined area to be relatively compact and clearly anchored to the project location.
Step 4: Calculate the Area-Weighted Unemployment Rate:
For the project tract and each contiguous tract proposed for inclusion, collect the relevant labor force and unemployment figures (typically derived from census-based data sources; will be discussed in the following blogs). Compute a weighted average unemployment rate for the combined area by summing the total number of unemployed individuals across all selected tracts and dividing that figure by the total labor force for those same tracts. The resulting combined unemployment rate must be at least 150% of the national average to qualify as a high-unemployment area. It is essential that this calculation be presented transparently and in sufficient detail so that a reviewer can independently verify the result.
In practice, high-unemployment area analyses frequently rely on more than one federally recognized data source because each measures unemployment using a distinct methodology and time horizon. The two most commonly used sources in EB-5 adjudications are the American Community Survey (“ACS”) 5-Year estimates and the Bureau of Labor Statistics’ Local Area Unemployment Statistics (“LAUS”). ACS data are survey-based and averaged over a five-year period, which tends to provide greater statistical stability for small geographies such as individual census tracts. By contrast, LAUS data are model-based and produced annually, offering a more current snapshot of labor market conditions but sometimes reflecting lower unemployment levels in distressed neighborhoods.
Because neither dataset is inherently superior in all circumstances, petitioners often present calculations using both sources to demonstrate that the project location qualifies as a high-unemployment area under multiple accepted federal methodologies. This dual-source approach reduces evidentiary risk by showing that, regardless of whether ACS or LAUS is applied, the combined area still exceeds 150% of the national unemployment rate. When different numbers of tracts are used across datasets, this typically reflects differences in data availability or methodological constraints rather than inconsistency in tract selection.
As a best practice, additional adjacent tracts should be added only as needed to reach the 150% threshold. Including more tracts than necessary is generally disfavored. Each added tract should meaningfully contribute to achieving the required average and must be directly contiguous to at least one tract already included in the group.
Illustrative Example of a Qualifying Contiguous Tracts
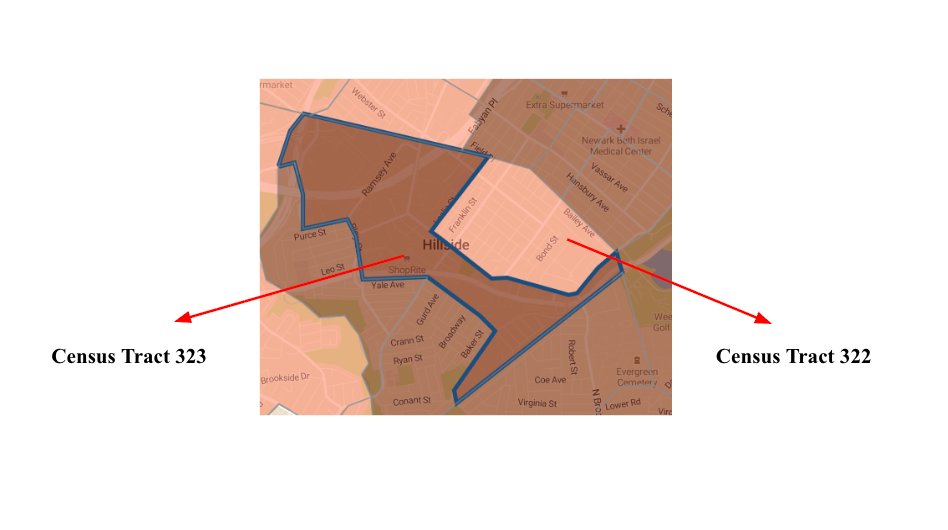
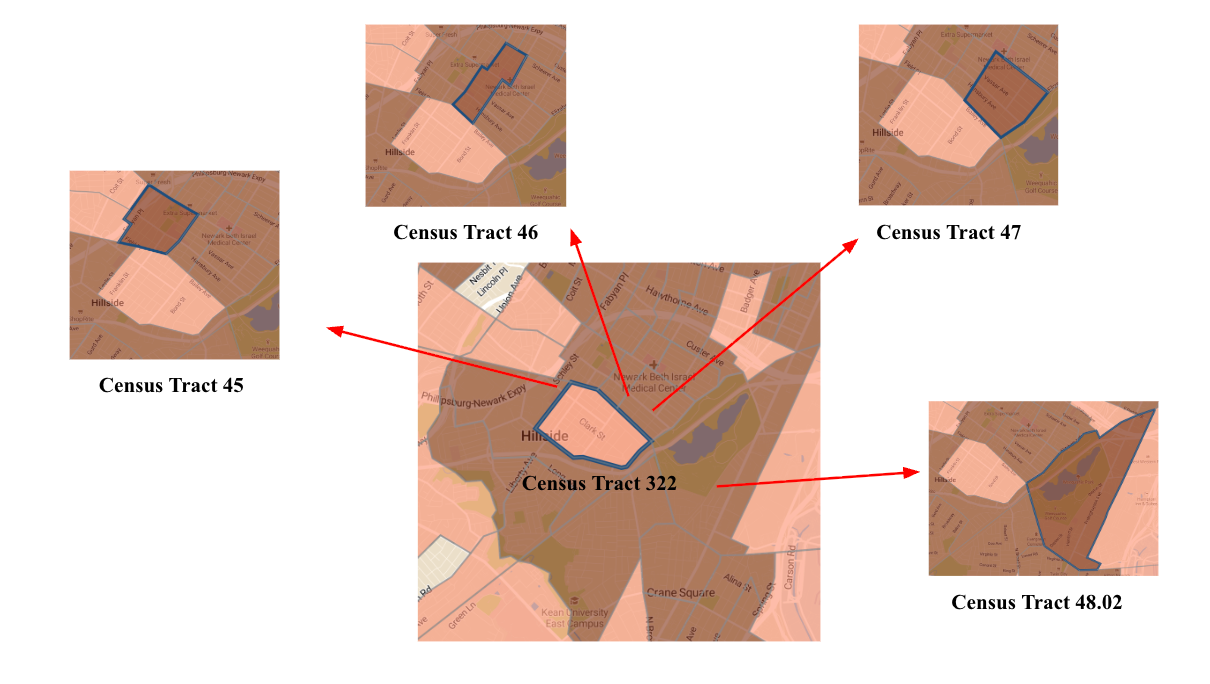
Census Tract 322, located directly adjacent to Census Tract 323, discussed in the prior example, illustrates how a tract may qualify through aggregation with neighboring tracts. Like Tract 323, Census Tract 322 is in Union County, New Jersey, within the New York–Newark–Jersey City Metropolitan Statistical Area (MSA), and therefore does not qualify as rural. It is part of Newark, a city with a population well above 20,000.
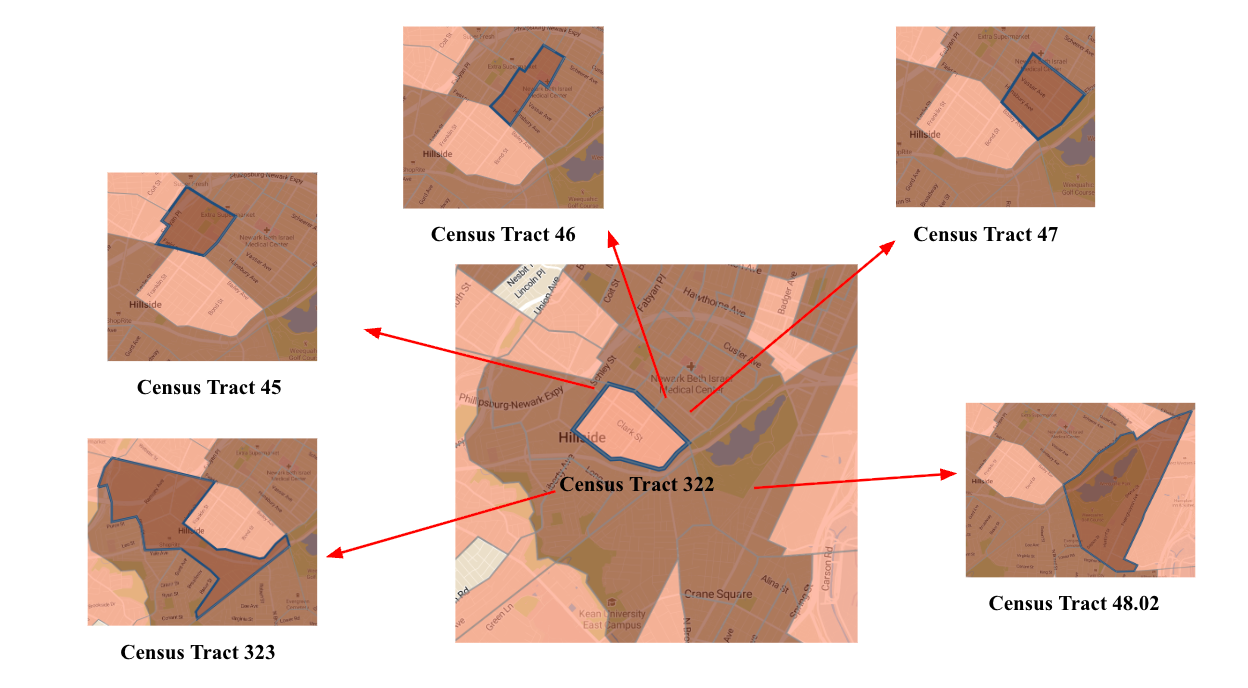
Census Tract 322 qualifies as a high-unemployment area when combined with adjacent tracts, specifically, by aggregating five neighboring tracts (starting from the bottom left: 323, 45, 46, 47, and 48.02) under ACS 2020–2024 5-Year data, and four neighboring tracts under LAUS 2024 1-Year data. Here, it is important to note that the different number of tracts used for ACS and LAUS does not reflect a change in the area being studied, but rather differences in how the two data sources are produced and applied. ACS provides multi-year survey estimates that are more reliable for small areas like census tracts, which supports the inclusion of five neighboring tracts in the aggregation. LAUS, by contrast, relies on model-based single-year estimates, and in this instance, the area-weighted unemployment rate already exceeded 150% of the national average when only four adjacent tracts were combined, making inclusion of a fifth tract unnecessary to meet the statutory threshold. In both cases, only directly contiguous tracts were included, and each grouping independently produces an unemployment rate well above 150% of the national average, thereby satisfying the TEA qualification.
1) ACS 2020–2024 5-Year Data
| Tract Name | Civilian Labor Force | Unemployment Rate (%) | Unemployed (Civilian Labor Force * Unemployment Rate) |
| Census Tract 322 (Project Tract) | 3,133 | 5.5 | 172.3 |
| Census Tract 48.02 | 951 | 13.9 | 132.2 |
| Census Tract 323 | 1,684 | 8.1 | 136.4 |
| Census Tract 45 | 1,623 | 21.7 | 352.2 |
| Census Tract 46 | 1,564 | 12.7 | 198.6 |
| Census Tract 47 | 3,169 | 10.5 | 332.8 |
| Total: 12,124 | Total: 1,324.47 |
The calculation of the area-weighted unemployment rate is shown below:
Weighted avg. unemployment rate =Total Numbers of Unemployed Civilian Civilian Labor Force
10.92=1,324.47 12,124
Weighted avg. unemployment rate =10.92%
The area-weighted average unemployment rate for Census Tract 322, together with five contiguous tracts (for a total of six tracts in the combined area) under ACS 2020–2024 5-Year data, is 10.9%, which represents 209.6% of the national average unemployment rate.
2) LAUS 2024 1-Year Tracts
The area-weighted average unemployment rate for Census Tract 322, together with four contiguous tracts (for a total of five tracts in the combined area excluding Census Tract 323) under LAUS 2024 1-Year data, is 7.6%, which represents 189.5% of the national average unemployment rate.
Conclusion
Successfully qualifying a project location as a high-unemployment TEA requires methodical analysis, transparent documentation, and strict adherence to regulatory standards. Whether your project qualifies through a single census tract or requires careful aggregation of contiguous areas, USCIS expects every calculation to be verifiable, every data source to be current and official, and every geographic boundary to be defensible. The examples of Census Tracts 323 and 322 in Union County demonstrate that with proper methodology, accurate tract identification, appropriate data selection, and clear weighted-average calculations, projects can confidently meet the 150% threshold and secure the reduced $800,000 investment amount. As you prepare your TEA documentation, remember that investing the time upfront to build a precise, well-supported analysis will save you from costly delays, RFEs, and potential denials down the road. In the EB-5 context, where both substantial capital and immigration status are at stake, there is no substitute for getting it right the first time.
Need help for EB-5 case? Contact us to navigate the right pathway for your case.
Ready to explore whether EB-5 or other investor visa options are right for your situation? Contact us for a personalized consultation to discuss your immigration and investment goals.
Disclaimer: This article provides general information and should not be construed as legal advice. For guidance tailored to your specific circumstances, please consult with a qualified immigration attorney.